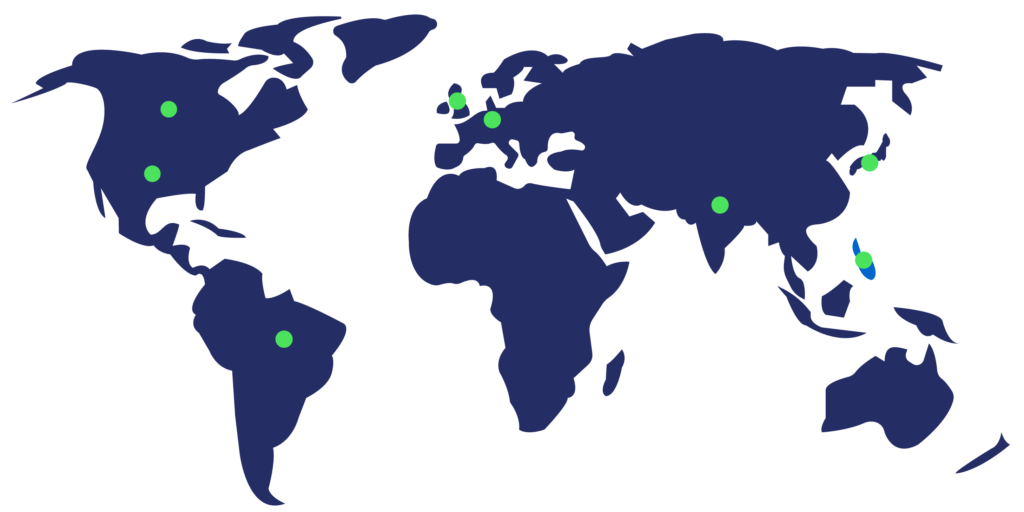
Total Participating Companies | 485 |
Companies with Non-U.S. Operations | 374 |
Total U.S.-Based Employees | 16.9 million |
Total Non-U.S.-Based Employees | 13.2 million |
Industries represented | 30 |
Median Disability Self Identification Percentage* | 4.6% |
Median New Hire Disability Self Identification Percentage* | 4.5% |
Number of Top Scoring Companies | 405 |
Number of Companies that Scored 100 | 294 |
Number of Companies that scored 90 | 66 |
Number of Companies that scored 80 | 45 |
Top 10 Industries Represented in 2023 DEI
Technology | 66 |
Banking, Financial, and Asset Management | 58 |
Healthcare, Health Service, and Healthcare Medical Facilities | 47 |
Consulting and Professional Services | 40 |
Insurance | 30 |
Manufacturing | 29 |
Retail and E-Commerce | 25 |
Energy and Utilities | 22 |
Pharmaceuticals | 17 |
Food, Beverage, and Groceries | 14 |
Telecommunications | 14 |
DEI Growth
Total DEI Participants

Fortune 100

Fortune 500

Am Law 200
